This article demonstrates how a spending calculation in Fundriver Balance will impact a specific fund, using rules that calculate based on Average of Pool, Average of Unit Price, and Average of Fund.
For all scenarios, we will be using formulas that calculate based upon the average values for the prior 12 periods (in this example, each period is a quarter) and a spending rate of 4 percent. The illustrations are done using an Excel spreadsheet so the formulas that Fundriver Balance uses for each calculation can be demonstrated to the reader.
Important Note: the nature of a Average of the POOL spending rule is that it assumes all funds get a distribution at the same rate. So if there is a fund(s) that don't participate in the rule but are in the investment pool, it means you are over-distributing (above your distribution rate) to all of the other funds. The recommendation is that that no funds should be excluded when using the Average of the POOL. If there is a fund that shouldn't get a spending distribution, it should still be included in the spending rule, but have a distribution rule set up to reinvest the distribution back to the fund. The net distribution for the fund would be $0.00 and the distribution rate will remain the same across all funds. See this article on how to set up distribution rules: Distribution Rules
Using one of the PERCENT AVERAGE methods for calculating spending is, by far, the most common strategy used by Fundriver Balance customers, with 63% using either Average of Pool, Average of Unit Price, or Average of Fund to calculate their spending. Percent Average by Fund' is the most common rule with nearly half of clients using that method to calculate spending.

Example: Average of the Pool

Above is what the screen should look like when setting up a Percent Average of the Pool rule in Fundriver Balance, based upon the criteria specified in the opening section. Rules are set up in Fundriver Balance by click on ORGANIZE > SPENDING RULES. Please see the article "How do I set up a spending rule?" for a step-by-step guide to creating a new spending rule.
In this example, the Total Pooled Market Value for each of the preceding 12 periods (quarters) is shown below. These values already exist in Fundriver Balance based on past closed periods or historical data that was loaded during implementation.

To show how the Average of Pool calculation will impact a single fund, Fundriver Balance must complete several calculations. First, the total spending for the pool is calculated by taking the Total Pooled Market Value average and dividing by spend rate.

Then, the Distribution Rate is figured by taking the Total Spending and dividing by Total Pool Units.
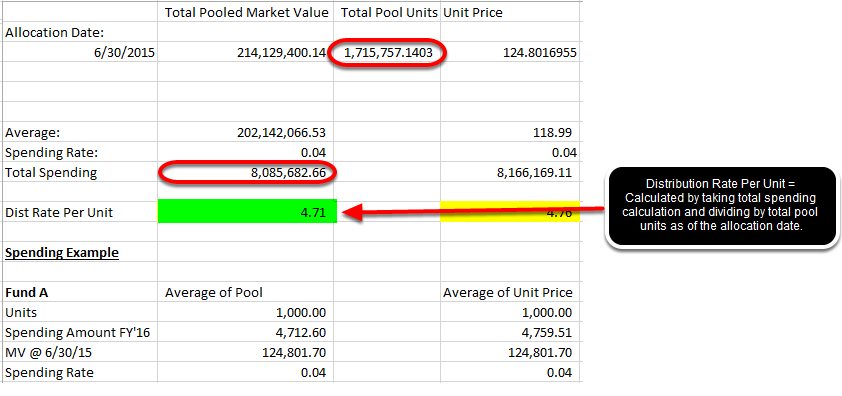
Once the distribution rate per unit is calculated, the spending is calculated by multiplying the number of units owned by the fund with the distribution rate per unit.

The spending amount calculated by Fundriver Balance for this example fund using the Average of Pool rule for FY 2016 is $4,712.60. The same calculation would be done for all funds in the pool with the same rule.
Example: Average of Unit Price

Above is what the screen should look like to set up this rule in Fundriver Balance, based on the criteria specified in the opening section.
In this example, the Unit Price for each of the preceding 12 periods (quarters) is shown below. These values already exist in Fundriver based on past closed periods or historical data that was loaded during implementation.

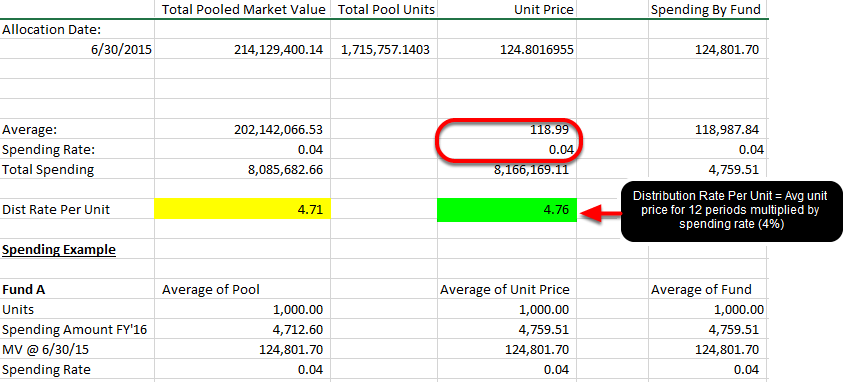
Once the distribution rate per unit is calculated, the spending is calculated by multiplying the number of units owned by the fund with the distribution rate per unit.

The spending amount calculated by Fundriver for this example fund using the Average of Unit Price rule for FY 2016 is $4,759.51. The same calculation would be done for all funds in the pool with the same rule.
Example: Average of Fund Rule

Above is what the screen should look like to set up this rule in Fundriver Balance, based on the criteria specified in the opening section.
In this example, the Spending by Fund column shows a fund's market value for each of the preceding 12 periods (quarters). The fund market value is calculated in Fundriver by taking the Unit Price for a given period and multiplying by the number of units in each fund.

The Spending Amount for FY 2016 is the same as the Total Spending Figure.
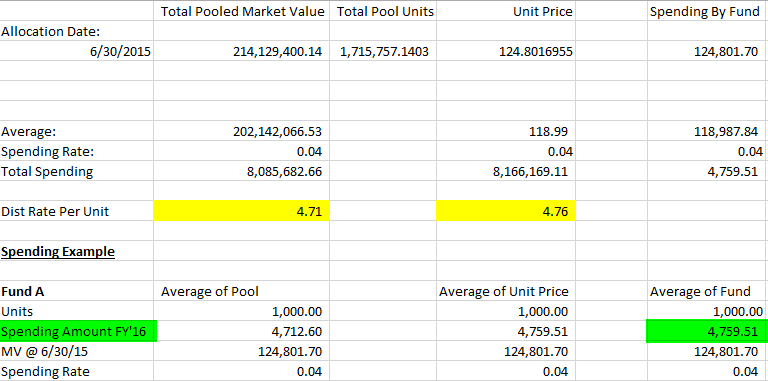
The spending amount calculated by Fundriver Balance for this example using the Average of Fund rule for FY 2016 is $4,759.51. The same calculation would be done for all funds in the pool with the same rule.
As you can see, the Average of Unit Price and Average of Fund calculations, in this case, resulted in the same spending amount. The Average of Pool calculation resulted in a slightly lower distribution amount.